What is SOM?
SOM is an unsupervised deep learning technique used for dimensionality reduction.
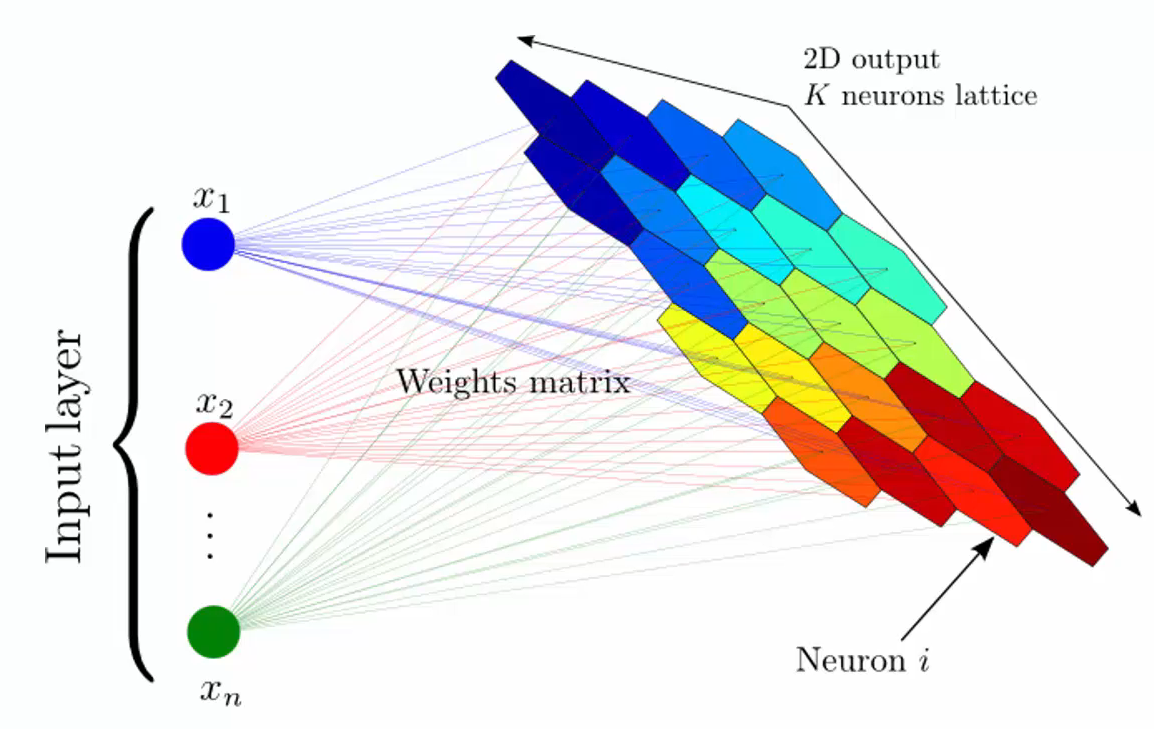
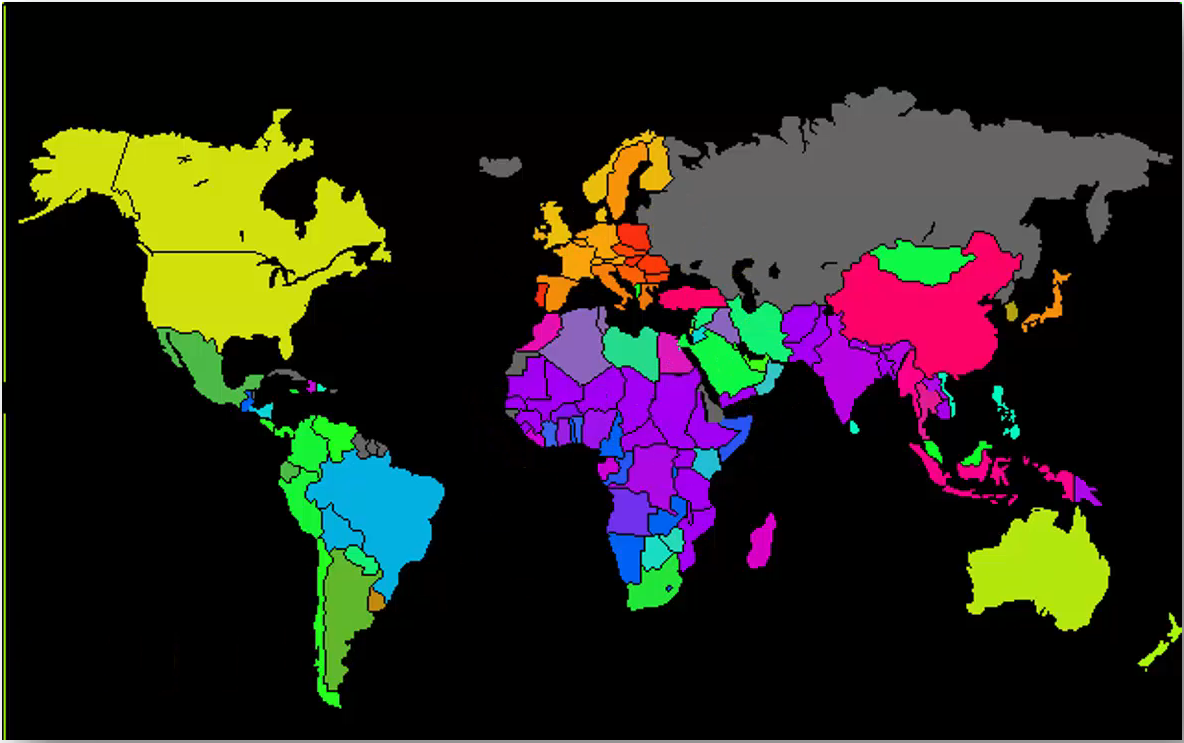
Here is an example of SOM in use:
How does SOM learn?
Here is a simple example of SOM structure:
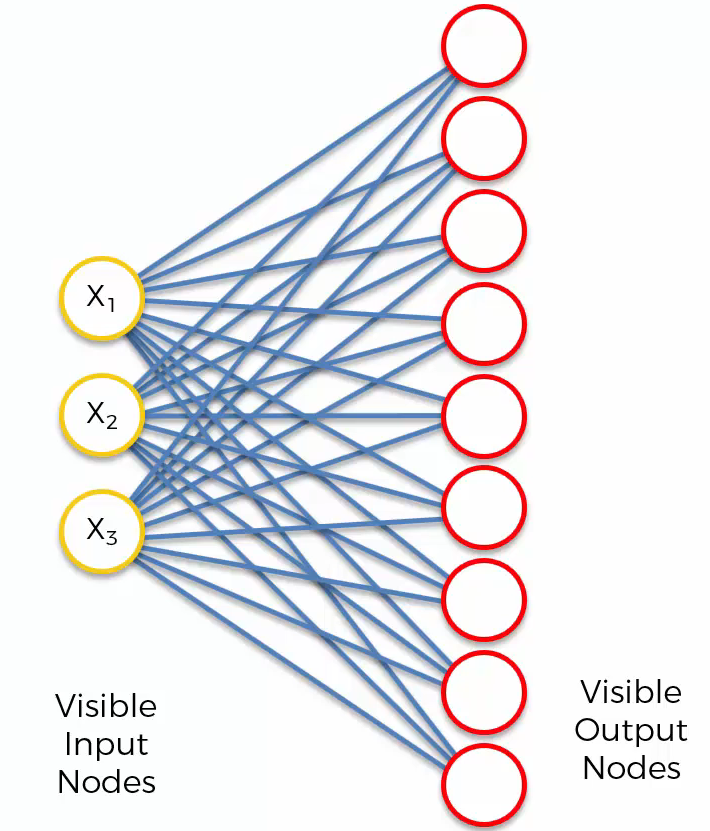
Unlike supervised deep learning methods such as ANN, CNN, and RNN, weights are not multiplied by input values. Weights represent the features of nodes.
For example, let’s assume we are dealing with the top of the output node.
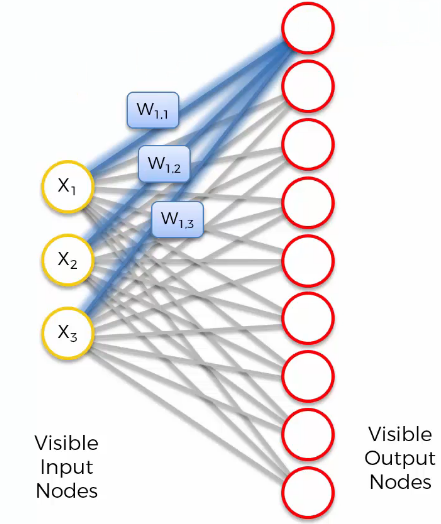
The output node’s features will be $W_{1,1}$, $W_{1,2}$, $W_{1,3}$. Additionally, there is no activation function.
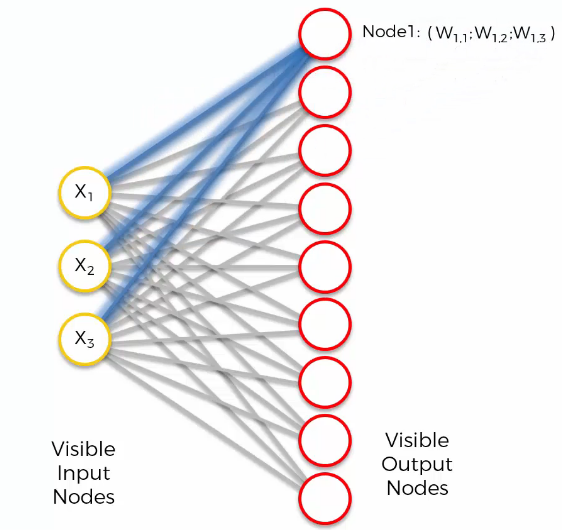
“Node 1” represents the coordinate of the input space. To understand this, let’s look at the features of each output node.
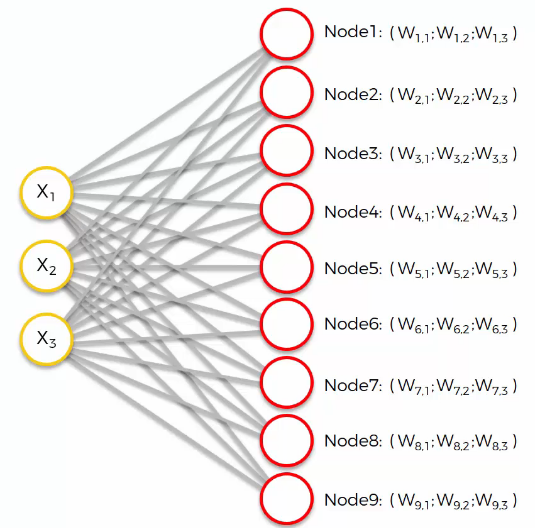
At the start of the algorithm, it usually assigns the weights randomly. Therefore, output nodes have their own imaginary place in the input space. Then, how does SOM get result?
First, let’s assume we are dealing with row 1. We calculate all distances between row 1 and the output nodes. Let’s say the distances are like:
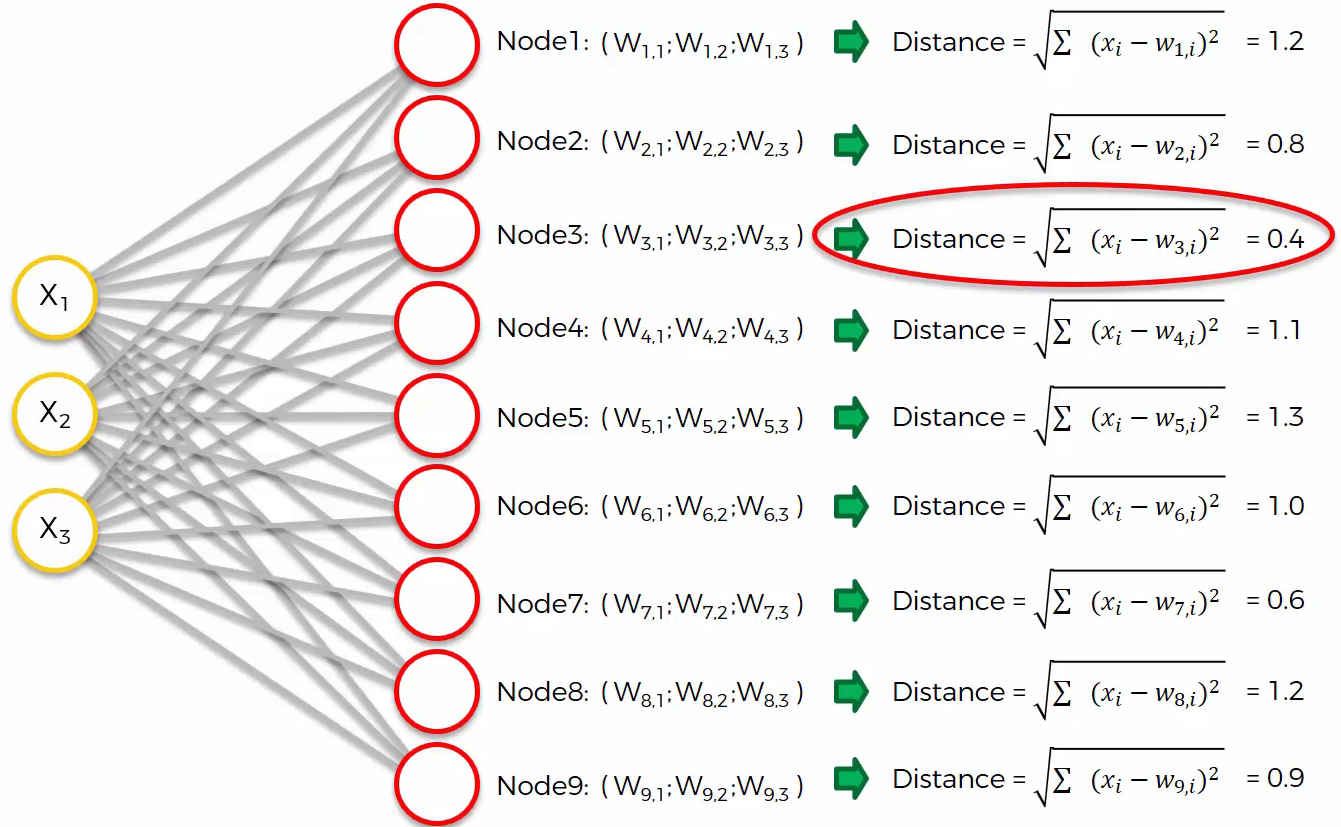
We find the closest node, which is ‘Node 3’, and we will call it the BMU (Best Matching Unit). Based on this result, let’s see what happens in the SOM.
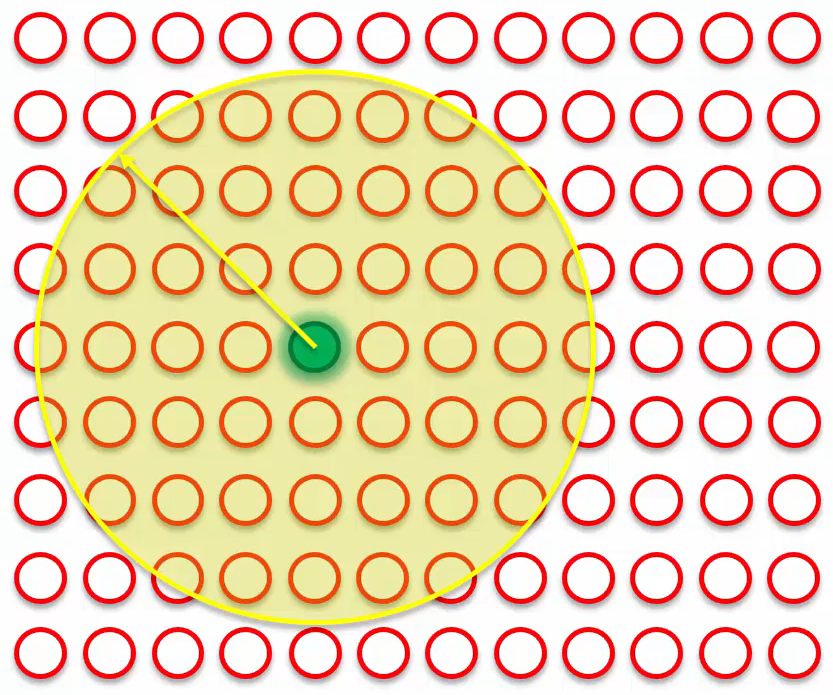
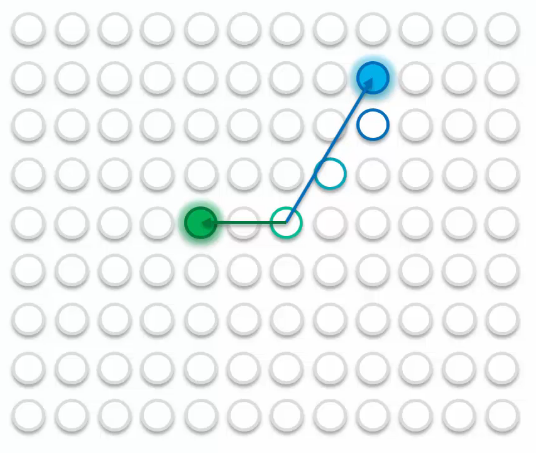
The green dot represents the BMU of row 1. The BMU will update the points within the yellow circles to be closer to row 1, with closer points updated more significantly than farther points. However, row 1 is not the only data point in the SOM; there are many more rows and their corresponding BMUs. For example, row 2’s BMU is colored blue.
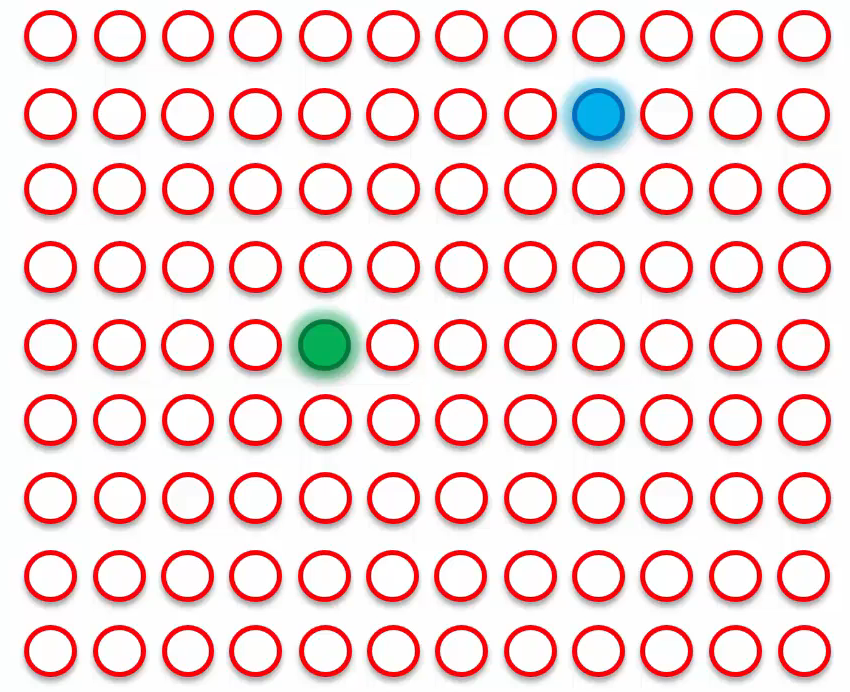
Let’s see four examples:
- A closer point to the blue point.
It is closer to the blue point than to the green point, so it will be updated similarly to the blue point.
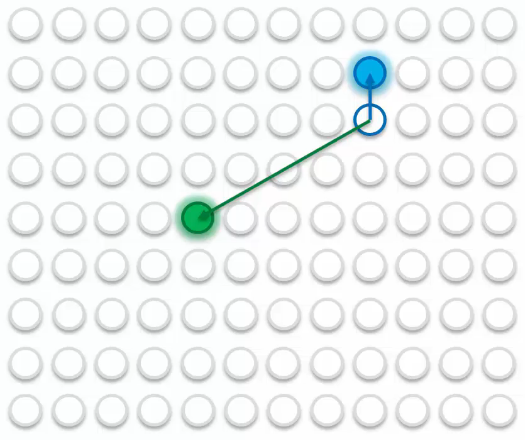
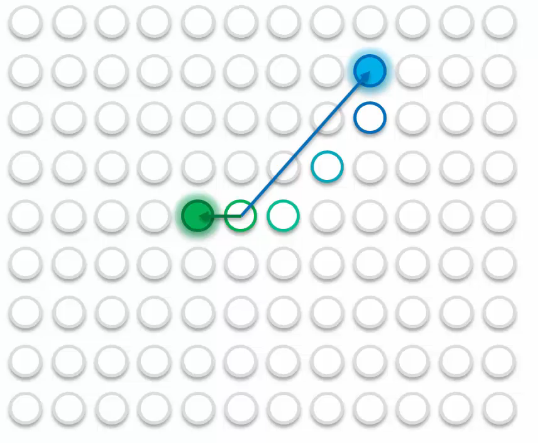
- A point a bit closer to the blue point
It will be updated similarly to the blue point, but is affected by green point.
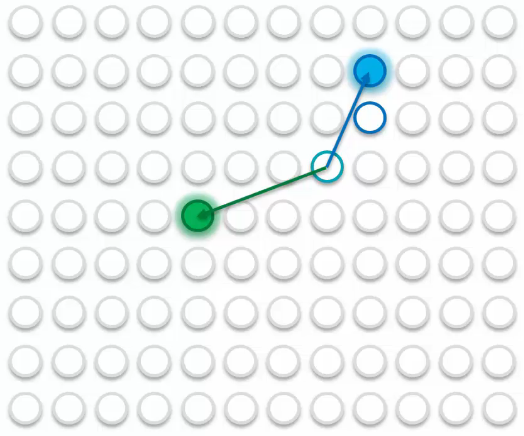
- A point a bit closer to the green point.
It will be updated similarly to the blue point but is also affected by the green point.
- A closer point to the green point.
It is closer to the green point than to the blue point, so it will be updated similarly to the green point.
What if there are more than two points?
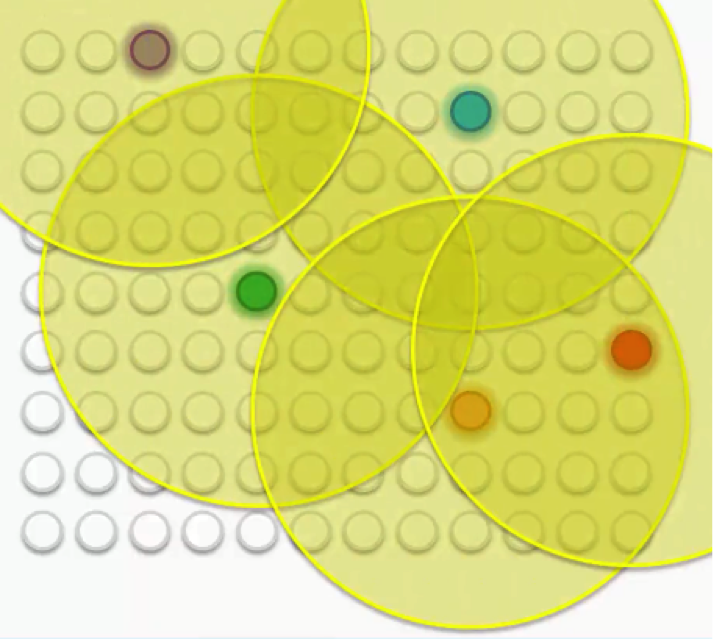
First, all nodes are updated as described above. Then, the radius of the yellow circle is shrunk by the Kohonen network algorithm.
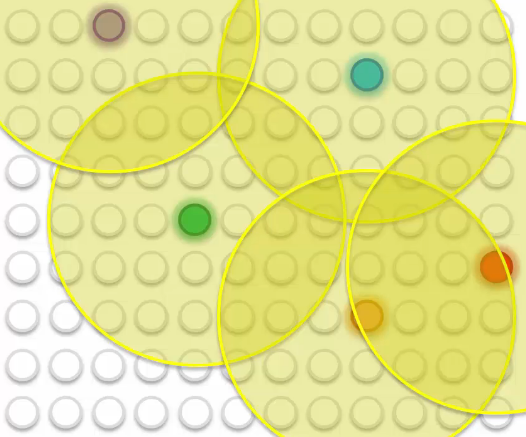
Repeat this process until all data fit well.
Visualize the entire process will be:
Example
In this example, we will extract potential frauds from credit card applications.
Code
1
2
3
4
5
6
7
8
9
10
11
12
13
14
15
16
17
18
19
20
21
22
23
24
25
26
27
28
29
30
31
from sklearn.preprocessing import MinMaxScaler
from minisom import MiniSom
from pylab import bone, pcolor, colorbar, plot, show

sc = MinMaxScaler(feature_range = (0, 1))
X = sc.fit_transform(X)

"""x, y represent the width and height of the map to be created
   input_len: number of features to input
   num_iteration: how many times to repeat"""
som = MiniSom(x=10, y=10, input_len=len(X[1]), sigma=1.0, learning_rate=0.5)
som.random_weights_init(X)
som.train_random(data=X, num_iteration=100)

# Visualizing the results.
bone()
# distance_map : Get the MID of the winning node of SOM
pcolor(som.distance_map().T)
colorbar()
markers = ['o', 's']
colors = ['r', 'g']
for i, x in enumerate(X):
    w = som.winner(x)
    plot(w[0] + 0.5,
         w[1] + 0.5,
         markers[y[i]],
         markeredgecolor=colors[y[i]],
         markerfacecolor='None',
         markersize=10,
         markeredgewidth=2)
show()
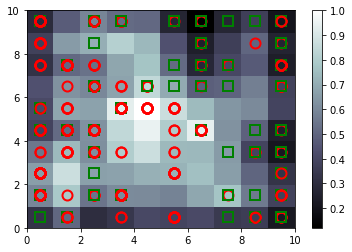
Result
- The red circle : disapprove.
- The green circle : approve.
- The color degree : the brighter the lower the risk.